

Victory has been around since 2016. The original idea behind Victory was to make it less painful to create decent looking data visualizations using React without having to be a D3.js or CSS expert.
Since its inception, Victory has wrapped some powerful D3.js APIs in a friendly React wrapper, abstracting over some of the inconsistencies between how D3.js and React manipulate the DOM, and added some ergonomics around styling visualization elements.
Victory renders SVG output, which has many benefits when targeting the web browser – but has the additional benefit of making it feasible to simultaneously target React Native mobile apps with an identical API using React Native SVG.
For the last several years, this is how Victory Native targeted native platforms with an API identical to Victory Web; under the hood, Victory Web and Victory Native use the same core React components and charting logic, but are configured to output different JSX elements for different elements in the data visualizations. For example, a line graph might use a standard <path /> svg element on web, but a <Path /> element from react-native-svg on native.
Victory Native and its Performance Problems
If you’ve worked on a React app or library at scale, you know that there are performance problems to solve. Often plenty of them. Becca Bailey did a stellar investigation and write-up on debugging Victory-adjacent performance issues in a React application. Some performance-related issues we’ve seen over and over again:
- We still have work to do on optimizing Victory to minimize React re-renders. Animations and gestures are prone to triggering re-renders of many elements on every frame of animations.
- With large datasets, using SVG to render data often means mounting and updating thousands of DOM nodes. This really taxes the user’s CPU and for large datasets often means frame drops if your data or gesture state changes.
These issues apply to both Victory Web and Victory Native. However, since Victory Native has relied on React Native SVG to render SVG graphics, and that library has well-documented performance issues (e.g. #1470), Victory Native has in the past been plagued with substantial performance issues when it comes to large datasets or gestures and animations (#2388, #2474, #2484, and more).
We’ve known about this problem for awhile, and have made attempts to tackle performance bottlenecks within the core of Victory itself, but addressing rendering performance of React Native SVG has been a bit beyond our bandwidth.
Revolutions in the React Native Ecosystem
There have been some game-changing advancements in the React Native ecosystem in the last few years. React Native Reanimated’s version 2.0 release made UI-thread animations much more accessible – allowing more and more React Native developers to write animations and gesture handling code that runs almost exclusively on the UI thread with minimal trips across the native/JS bridge. In my opinion, this has been a game changer for the React Native ecosystem, as it is a solid counterpoint to the argument that “React Native isn’t nearly performant enough”, while simultaneously making native animation much more accessible to React Native developers.
More recently, William Candillon and Christian Falch created React Native Skia – a React Native wrapper around Skia, the rendering engine that e.g. Flutter and Google Chrome use for UI rendering. Skia provides a performant and incredibly flexible API for painting graphics. RN Skia provides a declarative API for Skia drawing, while also allowing you to drop down to an imperative level when needed.
These changes to the React Native ecosystem have unlocked doors in the React Native space – allowing developers to write performant animation code without jumping through hoops, while providing a Canvas-esque environment to do flexible and performant drawing. In that spirit, we’d like to welcome Victory Native XL.
Victory Native XL: Putting it all together
Victory Native XL (XL for 40, representing a version 40 release of Victory Native) is a ground-up rewrite of Victory Native that diverges from the Victory Web API to leverage modern tooling in the React Native space, such as Reanimated, React Native Gesture Handler, and React Native Skia. The library favors flexibility and performance, allowing you to write custom Skia graphics with Reanimated-powered gestures and animations without thinking too hard about the mathematical complexities of charting and path drawing (thanks, D3.js!).
As an example of what Victory Native XL enables, the following showcases an experience similar to Apple Stocks that shows financial data with over one thousand data points, along with performant user interaction – all in around 300 lines of code.
Right now, Victory Native XL offers a relatively simple API for tracking user press gestures and exposes the “closest data point” as a Reanimated “shared value”, allowing you to animate UI accordingly. React Native Skia offers many clipping operation elements that makes it straight-forward to clip paths to show areas between two lines. With these primitives, complex data visualizations and mobile-oriented user gestures are just a few lines of code away.
Changes to the Victory Native API
When thinking about how to make a performant and flexible data visualization library, we didn’t want to be shackled by the API decisions made several years ago. API design in the React space has evolved over the last seven years, and we wanted to take a fresh approach that fit well with the underpinning technologies we were using. Therefore, we set aside the existing Victory APIs and went back to the drawing board, determined to create an API that allows large degrees of flexibility (to leverage Reanimated and Skia to their fullest potential) while trying to prevent performance footguns.
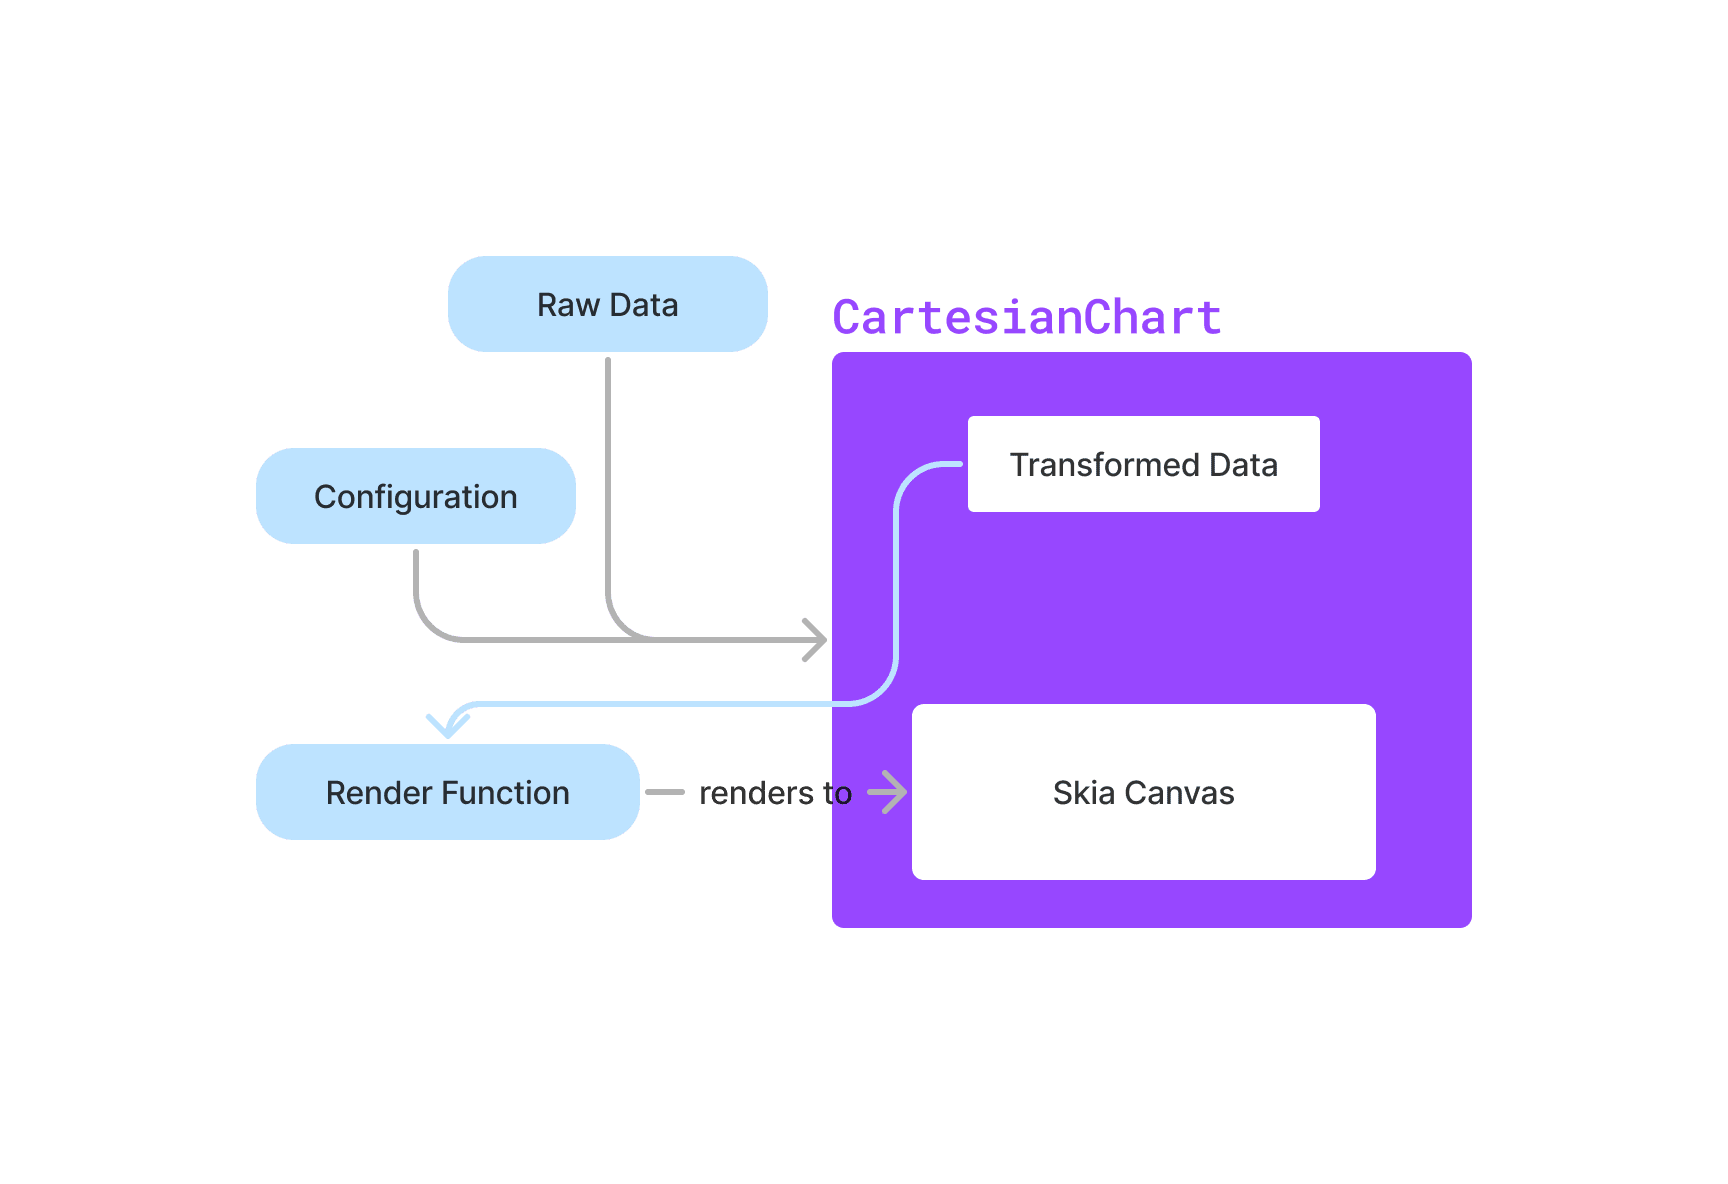
At a high level, the new API looks something like the following:
- You pass in your raw data as an array of objects and specify the keys you’ll be using for your data.
- Victory Native XL’s core
CartesianChartcomponent will transform that data into something that you can plot on a Skia canvas and expose that transformed data to you. - And you take that transformed data and draw on the Skia canvas to your heart’s desire (we provide plenty of helper components, such as
LineandBaras well).
This is illustrated below.
To add gesture support, Victory Native XL provides a hook to generate Reanimated SharedValues that you can pass into the CartesianChart component that will be tracked as the user interacts with the chart, allowing you to create performant, user-gesture-driven UI elements based on where the user’s finger(s) currently is.
Version 40 of Victory Native is chalk full of breaking changes, and the overall mental model is drastically different. For more fine-grained details about the new API, head on over to the docs and take a look around.
Saying “Hello” to the World
Now let’s walk through a “hello world” of an example. We’ll start by cooking up some mock data for that tracks “lows” and “highs” (of “something”) for each month within a year:
const DATA = Array.from({ length: 12 }, (_, index) => {
  const low = Math.round(20 + 20 * Math.random());
  const high = Math.round(low + 3 + 20 * Math.random());

  return {
    month: new Date(2020, index).toLocaleString("default", { month: "short" }),
    low,
    high,
  };
});
We’ll use the month key for our x-axis and low and high keys for the y-axis. We’ll pass the DATA variable, and our specified keys, into the CartesianChart component from victory-native:
import { CartesianChart } from "victory-native";

// ...

export function HelloWorldChart() {
  return (
    <CartesianChart data={DATA} xKey="month" yKeys={["low", "high"]}>
      {() => <></>}
    </CartesianChart/>
  );
}
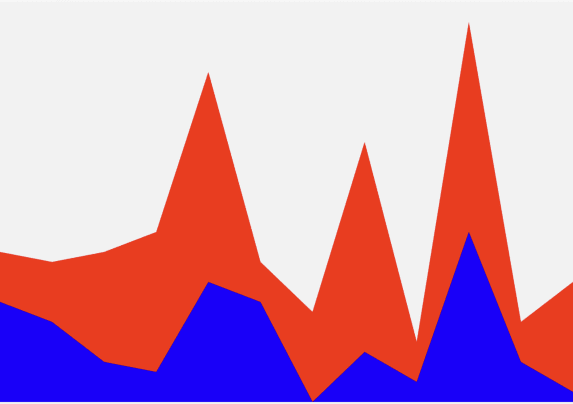
At this point, our component is just rendering an empty Skia canvas. Let’s create two area charts to represent the low/high values for each month. We’ll use the Area component from victory-native:
import { CartesianChart, Area } from "victory-native";

// ...

export function HelloWorldChart() {
  return (
    <CartesianChart data={DATA} xKey="month" yKeys={["low", "high"]}>
      {({ points, chartBounds }) => (<>
        {/* 👇 Add in a couple Area charts */}
        <Area points={points.high} y0={chartBounds.bottom} color="red" />
        <Area points={points.low} y0={chartBounds.bottom} color="blue" />
      </>)}
    </CartesianChart/>
  );
}
This renders a relatively simple visualization, as shown below.
This visualization is missing some important pieces in terms of usability. Let’s start by adding in some axes so we can read the data. We’ll use the axisOptions prop of the CartesianChart to add some default gridlines, axes and labels.
import { CartesianChart, Area } from "victory-native";
import { useFont } from "@shopify/react-native-skia";
import inter from "assets/inter-medium.ttf"; // <- your font

// ...

export function HelloWorldChart() {
  const font = useFont(inter, 12);

  return (
    <CartesianChart
      data={DATA}
      xKey="month"
      yKeys={["low", "high"]}
      // 👇 specify our font, opting into axes/grid
      axisOptions={{ font }}
    >
        {({ points, chartBounds }) => <>{/* ... */}</>}
    </CartesianChart/>
  );
}
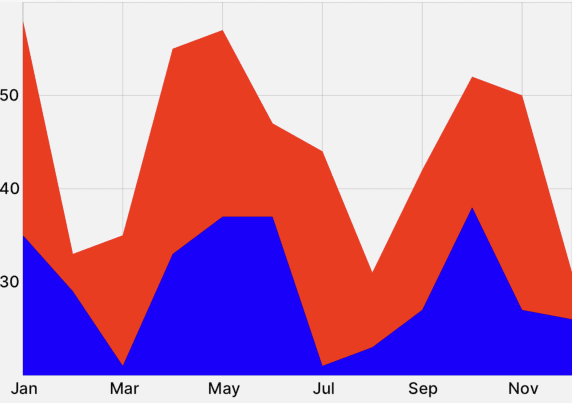
With this small change in place, we’ve got some basic grid lines and axes as shown below. Victory Native offers a plethora of options to customize the grid/axes/labels.
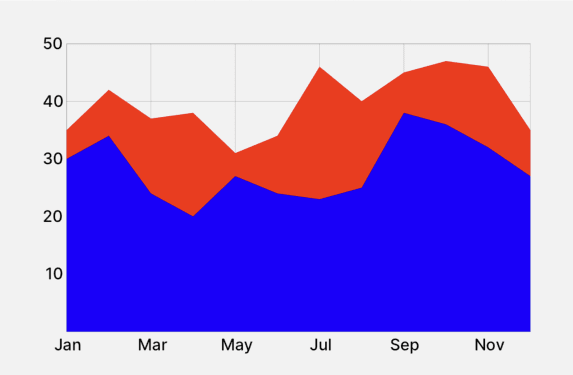
We can now read our data a bit better, but our visualization could use a little bit of prettying up. We can adjust our y-domain so the y-axis always starts at 0 using the domain prop, and add a little bit of breathing room to our visualization using the padding prop.
import { CartesianChart, Area } from "victory-native";
import { useFont } from "@shopify/react-native-skia";
import inter from "assets/inter-medium.ttf"; // <- your font

// ...

export function HelloWorldChart() {
  const font = useFont(inter, 12);

  return (
    <CartesianChart
      data={DATA}
      xKey="month"
      yKeys={["low", "high"]}
      axisOptions={{ font }}
      // 👇 Set y-domain minimum, and add a little padding.
      domain={{ y: [0] }}
      padding={32}
    >
      {({ points, chartBounds }) => <>{/* ... */}</>}
    </CartesianChart/>
  );
}
This generates something like what’s shown below.
At this point, we’ve primarily just used Victory Native XL’s APIs, but one of the design philosophies of Victory Native XL is to allow the ability to use Skia drawing elements directly so that you can harness the full power of Reanimated and Skia if you so choose.
Let’s add a little bit of over-the-top pizzazz to give a taste of what Reanimated and Skia can do (please don’t actually ship this to users, it’s a bit jarring).
The Area component from victory-native is just a fancy wrapper around Skia <Path /> elements, so we can pass shaders as children to these <Area /> elements to tap into Skia’s shading capabilities. I’ll omit some details, but by using Reanimated SharedValues, shader definitions, and shader “uniforms”, we can create some pretty impressive effects.
import * as React from "react";
import { CartesianChart, Area } from "victory-native";
import { useFont, Skia, Shader, LinearGradient } from "@shopify/react-native-skia";
import { useSharedValue, withTiming, withRepeat } from "react-native-reanimated";
import inter from "assets/inter-medium.ttf"; // <- your font

// ...

export function HelloWorldChart() {
  const font = useFont(inter, 12);

  // 👇 create a "time" variable
  const time = useSharedValue(0);
  // 👇 and loop it
  React.useEffect(() => {
    time.value = withRepeat(
      withTiming(30, { duration: 20 * 1000, easing: Easing.linear}),
      -1,
    );
  }, []);
  const uniforms = useDerivedValue(() => ({
    resW: 500,
    resH: 300,
    time: time.value,
  }));

  return (
    <CartesianChart
      data={DATA}
      xKey="month"
      yKeys={["low", "high"]}
      axisOptions={{ font }}
      domain={{ y: [0] }}
      padding={32}
    >
      {({ points, chartBounds }) => (
        <>
          <Area points={points.high} y0={chartBounds.bottom}>
              {/* 👇 use a shader to color the first Area path */}
              <Shader source={mindbend} uniforms={uniforms} />
          </Area>
          <Area points={points.high} y0={chartBounds.bottom}>
            {/* 👇 and a simple linear gradient for the second */}
            <LinearGradient
              start={{ x: 0, y: chartBounds.bottom }}
              end={{ x: 0, y: chartBounds.top }}
              colors={["#000000", "#00000080"]}
            />
          </Area>
        </>
      )}
    </CartesianChart/>
  );
}

// 👇 Have a shader party, modified from
// https://shaders.skia.org/?id=de2a4d7d893a7251eb33129ddf9d76ea517901cec960db116a1bbd7832757c1f
const mindbend = Skia.RuntimeEffect.Make(`
uniform float time;
uniform float resW;
uniform float resH;

float f(vec3 p) {
  p.z -= time * 10.;
  float a = p.z * .1;
  p.xy *= mat2(cos(a), sin(a), -sin(a), cos(a));
  return .1 - length(cos(p.xy) + sin(p.yz));
}

vec4 main(vec2 FC) {
  vec3 d = .5 - FC.xy1 / resH;
  vec3 p=vec3(0);
  for (int i = 0; i < 32; i++) {
    p += f(p) * d;
  }
  return ((sin(p) + vec3(2, 5, 12)) / length(p)).xyz1;
}
`)!;
The end result is impressive, albeit a bit jarring for an everyday experience. See below.
Although we left out plenty of topics such as touch gesture support, we hope this little “Hello world” gives you a taste of how easy it is to get started with Victory Native XL while still enabling low-level Reanimated and Skia controls.