Cartesian Chart
The CartesianChart component is the core component of victory-native. Its core responsibilities are:
- accepting raw data that you'd eventually like to chart, as well as some configuration around charting (such as options for axes, etc.)
- transforming that raw data into a format that can be easily accessed and used for charting with other
victory-nativecomponents.
Example
The example below shows a basic use of the CartesianChart.
import { View } from "react-native";
import { CartesianChart, Line } from "victory-native";
import { useFont } from "@shopify/react-native-skia";
// 👇 import a font file you'd like to use for tick labels
import inter from "../assets/inter-medium.ttf";

function MyChart() {
  const font = useFont(inter, 12);

  return (
    <View style={{ height: 300 }}>
      <CartesianChart
        data={DATA} // 👈 specify your data
        xKey="day" // 👈 specify data key for x-axis
        yKeys={["lowTmp", "highTmp"]} // 👈 specify data keys used for y-axis
        axisOptions={{ font }} // 👈 we'll generate axis labels using given font.
      >
        {/* 👇 render function exposes various data, such as points. */}
        {({ points }) => (
          // 👇 and we'll use the Line component to render a line path.
          <Line points={points.highTmp} color="red" strokeWidth={3} />
        )}
      </CartesianChart>
    </View>
  );
}

const DATA = Array.from({ length: 31 }, (_, i) => ({
  day: i,
  lowTmp: 20 + 10 * Math.random(),
  highTmp: 40 + 30 * Math.random(),
}));
Props
data (required)
An array of objects to be used as data points for the chart.
xKey (required)
A string value indicating the key of each data[number] object to be used on the independent (x) axis for charting. E.g. "day" if you want to use the "day" field of the data points for the x-axis.
The xKey prop must be a key for a field that has either a number or string type, as these are the values that can be reasonably serialized by Reanimated.
yKeys (required)
A string[] array of string indicating the keys of each data[number] object to be used on the dependent (y) axis for charting. E.g. yKeys={["lowTmp", "highTmp"]} if you want to chart both high and low temperatures on the y-axis and those values have keys of lowTmp and highTmp respectively.
This prop accepts an array of strings because the CartesianChart supports multiple ranges (e.g. plotting both high and low temperatures), and the CartesianChart component needs to know about all of the slices of the dataset you plan to plot (to e.g. determine the total range of the chart).
The yKeys prop must be keys for fields that have number values. That is, only numbers can be used as dependent values for charting purposes.
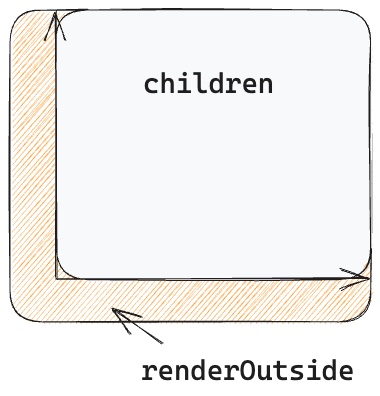
children (required)
The children prop is a render function whose sole argument is an object that exposes transformed data for you to use in your drawing operations. For example, the children render function's argument has a points field that exposes a version of your input data that's transformed to be plotted on the Canvas (see the Example section above for an example of this).
See the Render Function Fields section for an outline of all of the available fields on the render function argument.
The children function will render its Skia elements inside of a clipping group that sit inside of the bounds of the charts axes, so that your charting elements do not overflow outside of your axes.
padding
A number or an object of shape { left?: number; right?: number; top?: number; bottom?: number; } that specifies that padding between the outer bounds of the Skia canvas and where the charting bounds will occur.
For example, passing padding={{ left: 20, bottom: 20 }} will add 20 Density Independent Pixels (DIPs) of space to the bottom and left of the chart, but have the chart "bleed" to the right and top. Passing padding={20} will add 20 DIPs of space to all sides.
domain
An object of shape { x?: [number] | [number, number]; y?: [number] | [number, number] } that can be specified to control the upper and lower bounds of each axis. It defaults to the min and max of each range respectively.
For example, passing domain={{y: [-10, 100]}} will result in a y-axis with a lower bound of -10 and an upper bound of 100. For domain={{x: [1, 4]}}, will result in an x-axis contained within those bounds.
domainPadding
A number or an object of shape { left?: number; right?: number; top?: number; bottom?: number; } that specifies that padding between the outer bounds of the charting area (e.g. where the axes lie) and where chart elements will be plotted.
For example, passing padding={{ left: 20, right: 20 }} will add 20 DIPs of space between the edges of the chart and where the line/bar/area graph will start.
axisOptions
The axisOptions is an optional prop allows you to configure the axes and grid of the chart. If it is not present then the chart will not render any axes or grid. It is an object of the following optional properties:
| Property | Type | Description |
|---|---|---|
font | | Defines the font to be used for axis labels. If not provided, then no labels will be rendered. This font object is typically returned from Skia’s useFont hook. |
tickCount | | Defines the number of ticks to be rendered on both axes, or if provided an object, specific to x and y. If not provided, then the chart will attempt to choose a reasonable number of ticks based on the size of the chart. Note: This is an approximation; the scale may return more or fewer values depending on the domain, padding, and axis labels. |
tickValues | | Defines the explicit set of numeric tick values to be rendered on both axes, or if provided an object, specific to x and y. The tickValues prop is used to specify the values of each tick, so we only accept numeric values. Use the formatXLabel or formatYLabel options to customize how the ticks should be labeled. Note: If tickCount value is also provided, it will be used to downsample the provided tickValues array to the specified length. |
lineColor | | Defines the color of the grid and axis lines. It can either apply to both or be customized to each. It will default to black if none is provided. |
lineWidth | | Defines the width of the grid and axis lines. It can either apply to both or be customized to each. It will default to Stylesheet.hairlineWidth if none is provided. |
labelColor | | Defines the color of the axis labels. It can either apply to both or be customized to each. It will default to black if none is provided. |
labelOffset | | Defines the offset of the axis labels. It can either apply to both or be customized to each. It will default to 0 if none is provided. |
labelPosition | | Defines the position of the axis labels. It can either apply to both or be customized to each. It will default to outset if none is provided.ⓘ AxisLabelPosition is an enum with the values: 'inset | 'outset'. |
axisSide | | Defines the side of the chart that the x and y axis is rendered on. It will default to left and bottom if none is provided. ⓘ XAxisSide is an enum with the values: 'top' | 'bottom'.ⓘ YAxisSide is an enum with the values: 'left' | 'right' |
formatXLabel | | Defines a function provide customization for formatting the x-axis labels. It will default to just returning the value as a string if no function is provided. |
formatYLabel | | Defines a function provide customization for formatting the y-axis labels. It will default to just returning the value as a string if no function is provided. |
chartPressState
The chartPressState prop allows you to pass in Reanimated SharedValues that will be used to track the user's "press" gesture on the chart. This is generally used for creating some sort of tooltip/active value indicator. See the Chart Gestures page for more in-depth information on how to use this prop.
The chartPressState prop has a type of ChartPressState | ChartPressState[], where ChartPressState is an object generated from the useChartPressState hook.
If you have a data point whose y-value is null or undefined, when that point is "active" the gesture state will return NaN for the y-value and y-position.
renderOutside
The renderOutside prop is identical to the children prop in form, but it will render elements at the root of the Skia canvas (not inside of a clipping group). This allows you to render elements outside of the bounds of any axes that you have configured.
onChartBoundsChange
The onChartBoundsChange prop is a function of the shape onChartBoundsChange?: (bounds: ChartBounds) => void; that exposes the chart bounds, useful if you need access to the chart's bounds for your own custom drawing purposes.
gestureLongPressDelay
The gestureLongPressDelay prop allows you to set the delay in milliseconds before the pan gesture is activated. Defaults to 100.
Render Function Fields
The CartesianChart children and renderOutside render functions both have a single argument that is an object with the following fields.
points
An object of the form Record<YKey, PointsArray> where YKey is the type of the yKeys argument to the CartesianChart component and PointsArray is of the following shape:
type PointsArray = {
  x: number;
  xValue: number;
  y: number;
  yValue: number;
}[];
This object exposes the raw data in a transformed form for drawing on the Skia canvas.
As an example, if you pass yKeys={["highTmp"]} to a <CartesianChart /> element, then points.highTmp will give you an array of points to either use directly for drawing purposes, or to pass to an e.g. Line or Bar component.
canvasSize
An object of the shape { width: number; height: number; } that represents the overall size of the Skia canvas that the chart renders on.
chartBounds
An object of the shape { left: number; right: number; bottom: number; top: number; } that represents the Skia coordinates of the bounding box for the "drawing area" of the chart (that is, the area that sits inside of the chart's axes).
xScale
A d3-scale linear scale used for mapping the raw data's independent variable onto the canvas's horizontal axis.
yScale
A d3-scale linear scale used for mapping the raw data's dependent variables onto the canvas's vertical axis.