Basic Bar Chart
This guide will show you how to create this bar chart with some customization like corners and gradients using the CartesianChart and Bar components.
To get started, you'll want to import the required components from Victory Native and React Native. For this guide we will assume this is being created in a
Viewthat represents a page or screen.import { Bar, CartesianChart } from "victory-native"Create some mock data. Victory Native requires data to be an array of objects with properties that can map to an
xkey and aykey. Read more about the data and key props. In this example we want a bar graph to show the number of listens a song gets for each month.const data = Array.from({ length: 6 }, (_, index) => ({
// Starting at 1 for Jaunary
month: index + 1,
// Randomizing the listen count between 100 and 50
listenCount: Math.floor(Math.random() * (100 - 50 + 1)) + 50,
}))Connect the data and render the bar chart with default options:
<CartesianChart
  data={data}
  /**
   * 👇 the xKey should map to the property on data of you want on the x-axis
   */
  xKey="month"
  /**
   * 👇 the yKey is an array of strings that map to the data you want
   * on the y-axis. In this case we only want the listenCount, but you could
   * add additional if you wanted to show multiple song listen counts.
   */
  yKeys={["listenCount"]}>
  {({ points, chartBounds }) => (
    <Bar
      chartBounds={chartBounds}  // 👈 chartBounds is needed to know how to draw the bars
      points={points.listenCount} // 👈 points is an object with a property for each yKey
    />
  )}
</CartesianChart>
Once rendering, it should look like this:
By default, the first and last bar will be cut off by the edge of the chart. This is because the
Barcomponent is using thechartBoundsto know where to draw the bars. ThechartBoundsare the bounds of the chart, not the bounds of the data. To fix this, we can add some domain padding to the chart.Next we want to render axis labels with the month names. We will need a font object from React Native Skia. To get a font object, we use the
useFonthook and pass it a ttf file and a size. We will also use theformatXLabelprop to format the month number from a number to a month name.//👇 Import useFont from React Native Skia
import { useFont } from "@shopify/react-native-skia"
//👇 Also import a ttf file for the font you want to use.
import inter from "../fonts/inter-medium.ttf"
const MusicChart = () => {
const font = useFont(inter, 12) //👈 Create a font object with the font file and size.
return (
<CartesianChart
data={data}
xKey="month"
yKeys={["listenCount"]}
// 👇 Add domain padding to the chart to prevent the first and last bar from being cut off.
domainPadding={{ left: 50, right: 50, top: 30 }}
axisOptions={{
/**
* 👇 Pass the font object to the axisOptions.
* This will tell CartesianChart to render axis labels.
*/
font,
/**
* 👇 We will also use the formatXLabel prop to format the month number
* from a number to a month name.
*/
formatXLabel: (value) => {
const date = new Date(2023, value - 1);
return date.toLocaleString("default", { month: "short" });
},
}}
>
{({ points, chartBounds }) => (
<Bar
chartBounds={chartBounds}
points={points.listenCount}
/**
* 👇 We can round the top corners of our bars by passing a number
* to the roundedCorners prop. This will round the top left and top right.
*/
roundedCorners={{
topLeft: 5,
topRight: 5,
}}
/>
)}
</CartesianChart>
)
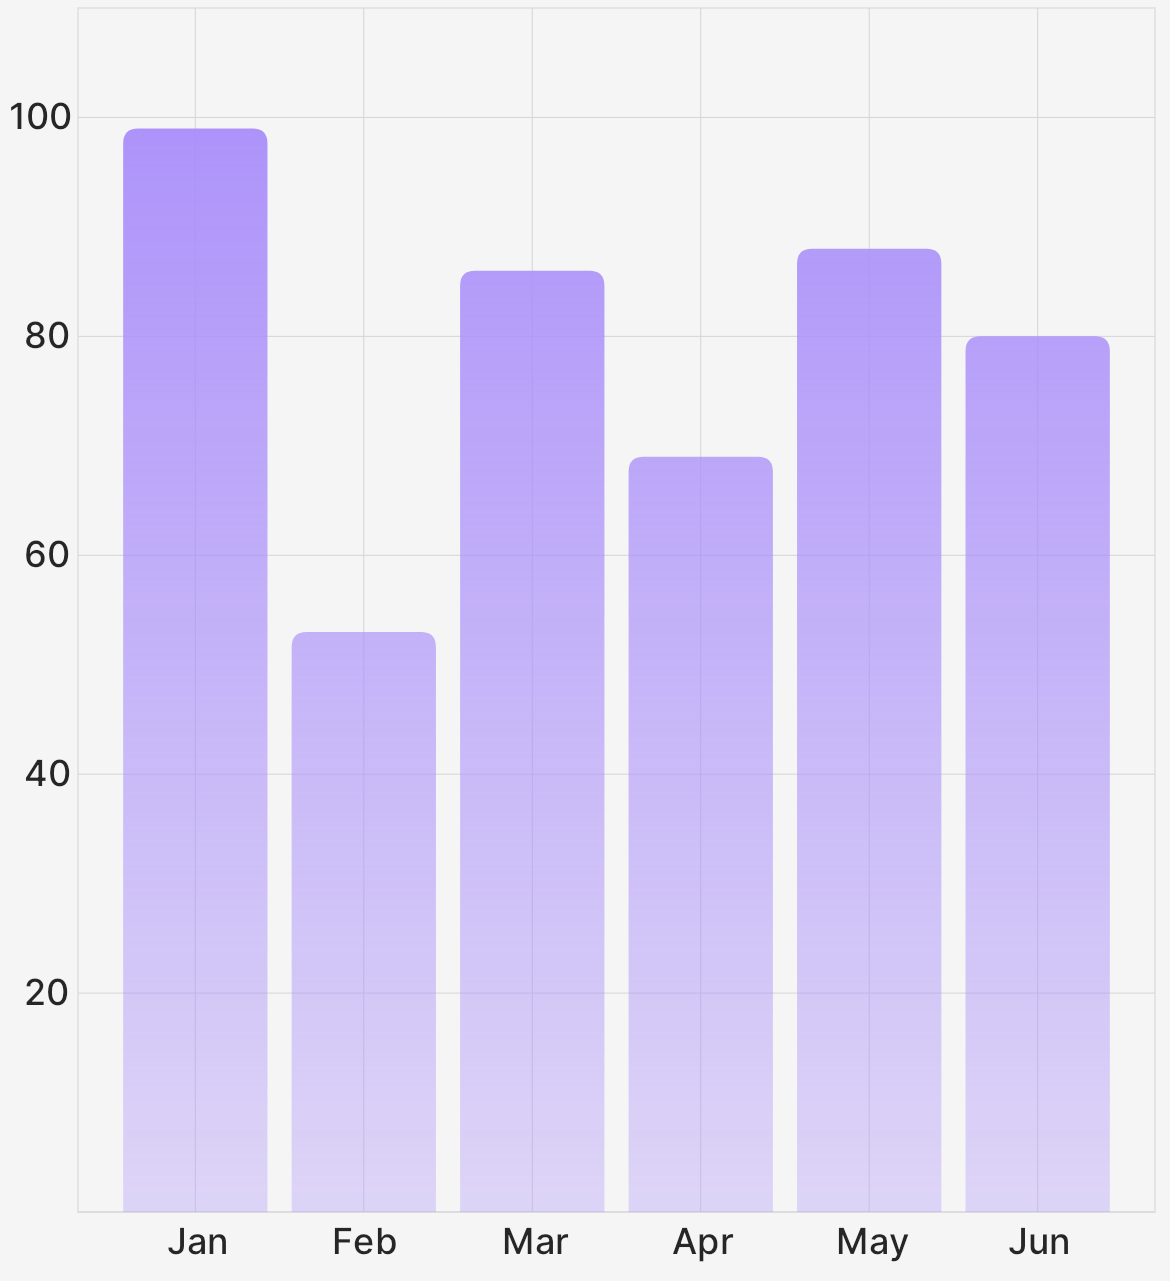
}Finally, to add a Linear Gradient fill to our bars, we use the
LinearGradientcomponent we imported and pass it as a child to theBarcomponent.//👇 Add LinearGradient and vec to our imports React Native Skia
import { LinearGradient, useFont, vec } from "@shopify/react-native-skia"The
LinearGradientcomponent takes astartandendprop that are vectors that represent the direction of the gradient. It also takes acolorsprop that is an array of strings that represent the colors of the gradient. The first color in the array will be the start color and the last color in the array will be the end color. You can also add additional colors to the array to create a gradient with more than two colors.<Bar
// same props as above
>
{/* 👇 We add a gradient to the bars by passing a LinearGradient as a child. */}
<LinearGradient
start={vec(0, 0)} // 👈 The start and end are vectors that represent the direction of the gradient.
end={vec(0, 400)}
colors={[ // 👈 The colors are an array of strings that represent the colors of the gradient.
"#a78bfa",
"#a78bfa50" // 👈 The second color is the same as the first but with an alpha value of 50%.
]}
/>
</Bar>The final result should look like this:
Here is the complete code for this example:
import { View } from "react-native"
import { Bar, CartesianChart } from "victory-native"
import { LinearGradient, useFont, vec } from "@shopify/react-native-skia"
import inter from "../fonts/inter-medium.ttf"

const MusicChart = () => {
  const font = useFont(inter, 12)
  const data = Array.from({ length: 6 }, (_, index) => ({
    month: index + 1,
    listenCount: Math.floor(Math.random() * (100 - 50 + 1)) + 50,
  }))

  return (
    <CartesianChart
      data={data}
      xKey="month"
      yKeys={["listenCount"]}
      domainPadding={{ left: 50, right: 50, top: 30 }}
      axisOptions={{
        font,
        formatXLabel(value) {
          const date = new Date(2023, value - 1)
          return date.toLocaleString("default", { month: "short" })
        },
      }}
    >
      {({ points, chartBounds }) => (
        <Bar
          chartBounds={chartBounds}
          points={points.listenCount}
          roundedCorners={{
            topLeft: 5,
            topRight: 5,
          }}
        >
          <LinearGradient
            start={vec(0, 0)}
            end={vec(0, 400)}
            colors={["#a78bfa", "#a78bfa50"]}
          />
        </Bar>
      )}
    </CartesianChart>
  )
}