
Recently we released the urql DevTools, a Chrome extension that allows you to inspect operations as they’re flowing through your urql GraphQL client. This was the start of making the client more accessible for everyday development. However, personally, I’ve found that most of my time developing apps with GraphQL is spent looking at data.
Whenever I've needed to see what data my app is currently consuming I've used a mixture of the network tab in the built-in Chrome inspector and some console.logs here and there to see any extra information about the request that won't be part of the response.
In its current state, the urql DevTools make it easy to understand how these responses come in, but you’re still not able to observe your GraphQL data as a whole.
We wanted a simpler way for users to see what data their app is currently consuming with a clear overview of which exact query produced which response, without the need to check the network tab manually. We also wanted to see that data update in real time and include any metadata such as cache outcomes as part of the view.
We’ve been looking at solving this problem and our solution to it ends up being a new feature in the urql DevTools. Today we’re happy to show you the new Explorer view!
With GraphQL we have some common problems when building apps 🤔
— Phil Pluckthun (@_philpl) September 20, 2019
💬 What are the arguments for that field?
💬 Is this result from my cache?
💬 Show me all the data tho!
💬 What data did just update?
♥️ The urql Explorer shows all of this!
Why do we need an Explorer view?
The DevTools already have two distinct features: Events and Request. The Events view lets you see a timeline of all the operations being streamed through the exchange pipeline, while the Request view lets you send one-off queries to your GraphQL API directly from the DevTools.
With these two views, you’re able to inspect and trigger operations, which is useful for understanding the timing of operations and how they influence your app. However they aren’t great for understanding one core problem: W_hat data is my app currently consuming_?
When designing the Explorer view, one of the biggest considerations we had to make was the fact that urql's architecture is very flexible. Whatever solution we came up with also had to work with third-party caching exchanges with minimal overhead to the authors of those exchanges.
When we investigated other GraphQL developer tools it seemed like the most common approach is to show a visual representation of the normalised cache data to users. This wouldn't work in our case since anyone could write their own cache with their own data structures, normalised or otherwise!
We decided to take a different approach: we treat the GraphQL results similarly to client-side state or a "store". We merge all results into a single state and show them as a whole. This way we can show changes to the data in a way that differs from the network tab and give more immediate feedback regarding changes that could potentially be reflected in UIs.
This approach allowed us to add nice features like always displaying the most recent data and highlighting any updates. It also makes the Explorer independent from the cache that you may be using. If we chose to display the cache data directly, we would have had to require any cache exchange to implement some code specific to the developer tools, which would make them less flexible.
Introducing Explorer
The Explorer view is similar to what you’d expect from Redux DevTools. It is a tree view of all the GraphQL results that your app has received combined. This allows you to see various key information about your app’s state across all your queries at the same time.
Overview of all responses separated by query

When you have incoming responses we split them by their fields and field arguments, organize them into a folder-like tree view, and display all types. In our example, we have a response for a User query with a field me and two separate Thread entries for a threads query sorted by LATEST and OLDEST.
Cache outcomes
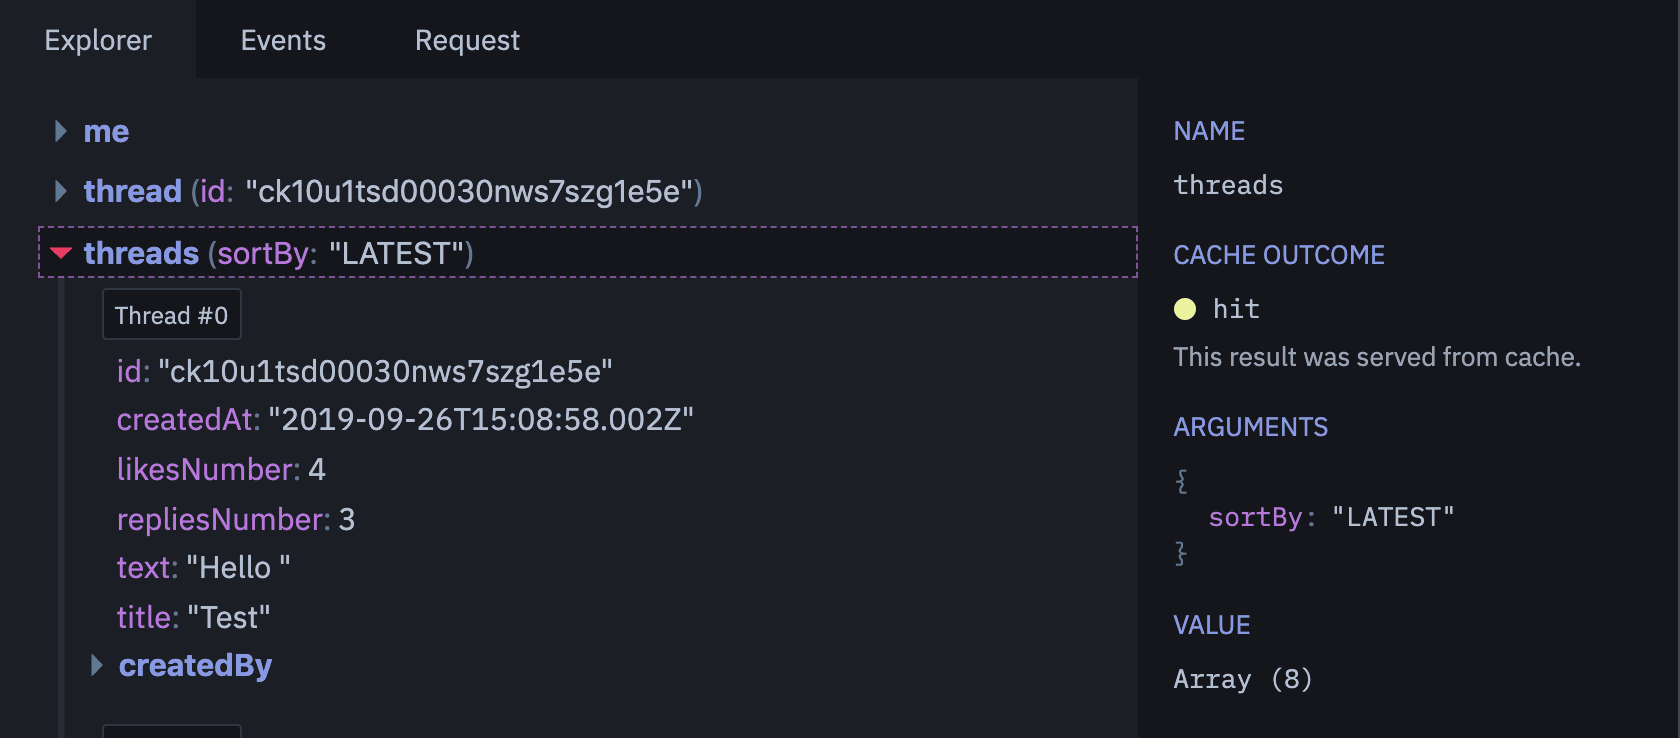
The details sidebar includes information on whether the result was a cache hit or a miss, which is a flag that caching exchanges have to add to their results.
We also display more information on the selected field there, like all its arguments and a terse summary of its values.
In the future we'll be able to detect partial results, too.
Value update highlights
We felt there is a lot of value in giving visual feedback to users when values update. You'll be able to see inline updates in the Explorer for all values in the app, as it's sending new queries. This way you'll easily be able to detect updates and make sure any data changes match UI updates.
Due to the way we're displaying any results (collapsed treeview) we also wanted to add updates for all collapsed nodes that have children. If a child value updates on a collapsed node, the parent flashes to let the user know that a value has changed.
The first iteration of Explorer is now finished and we're very pleased with the results so far! We managed to include all the features we wanted and we've already had some great results debugging some broken cache resolvers and unexpected updates.
Future of urql DevTools
We’re very excited to be experimenting with new ideas around what a GraphQL client should be able to do! At the moment the DevTools are still in beta and we’re focusing on increasing their stability and improving them overall, so if you have features you'd like to see make a PR or open an issue. We're always open to contributions!
If you want to try out urql DevTools in your project just follow these four simple steps:
- Install urql developer tools for Chrome
- Add the exchange to your project
yarn add --dev @urql/devtools/npm i —save-dev @urql/devtools import { devtoolsExchange } from '@urql/devtoolsand add the exchange to your exchanges array[ devtoolsExchange, ...defaultExchanges ]- Open the urql tab in your Chrome developer tools and start debugging!