Introducing Webpack Dashboard & Electron Webpack Dashboard 1.0

“Tang sucks” - Buzz Aldrin
After releasing Webpack Dashboard and Electron Webpack Dashboard, we realized that we had hit a sweet spot for developer tooling. Developers wanted to be able to have more transparency and more visual feedback from their build processes (and they liked feeling like they worked at NASA, too). So we gathered our finest minds, opened our editors and got working on a stable release.
That release is finally here: stable 1.0 releases of Webpack Dashboard and Electron Webpack Dashboard. We have done some major bug fixing, added better documentation, and added a couple of new cool features. If you haven’t tried either before, get started by downloading Electron Webpack Dashboard, or learn how to get Webpack Dashboard running for your project.
So What’s New?
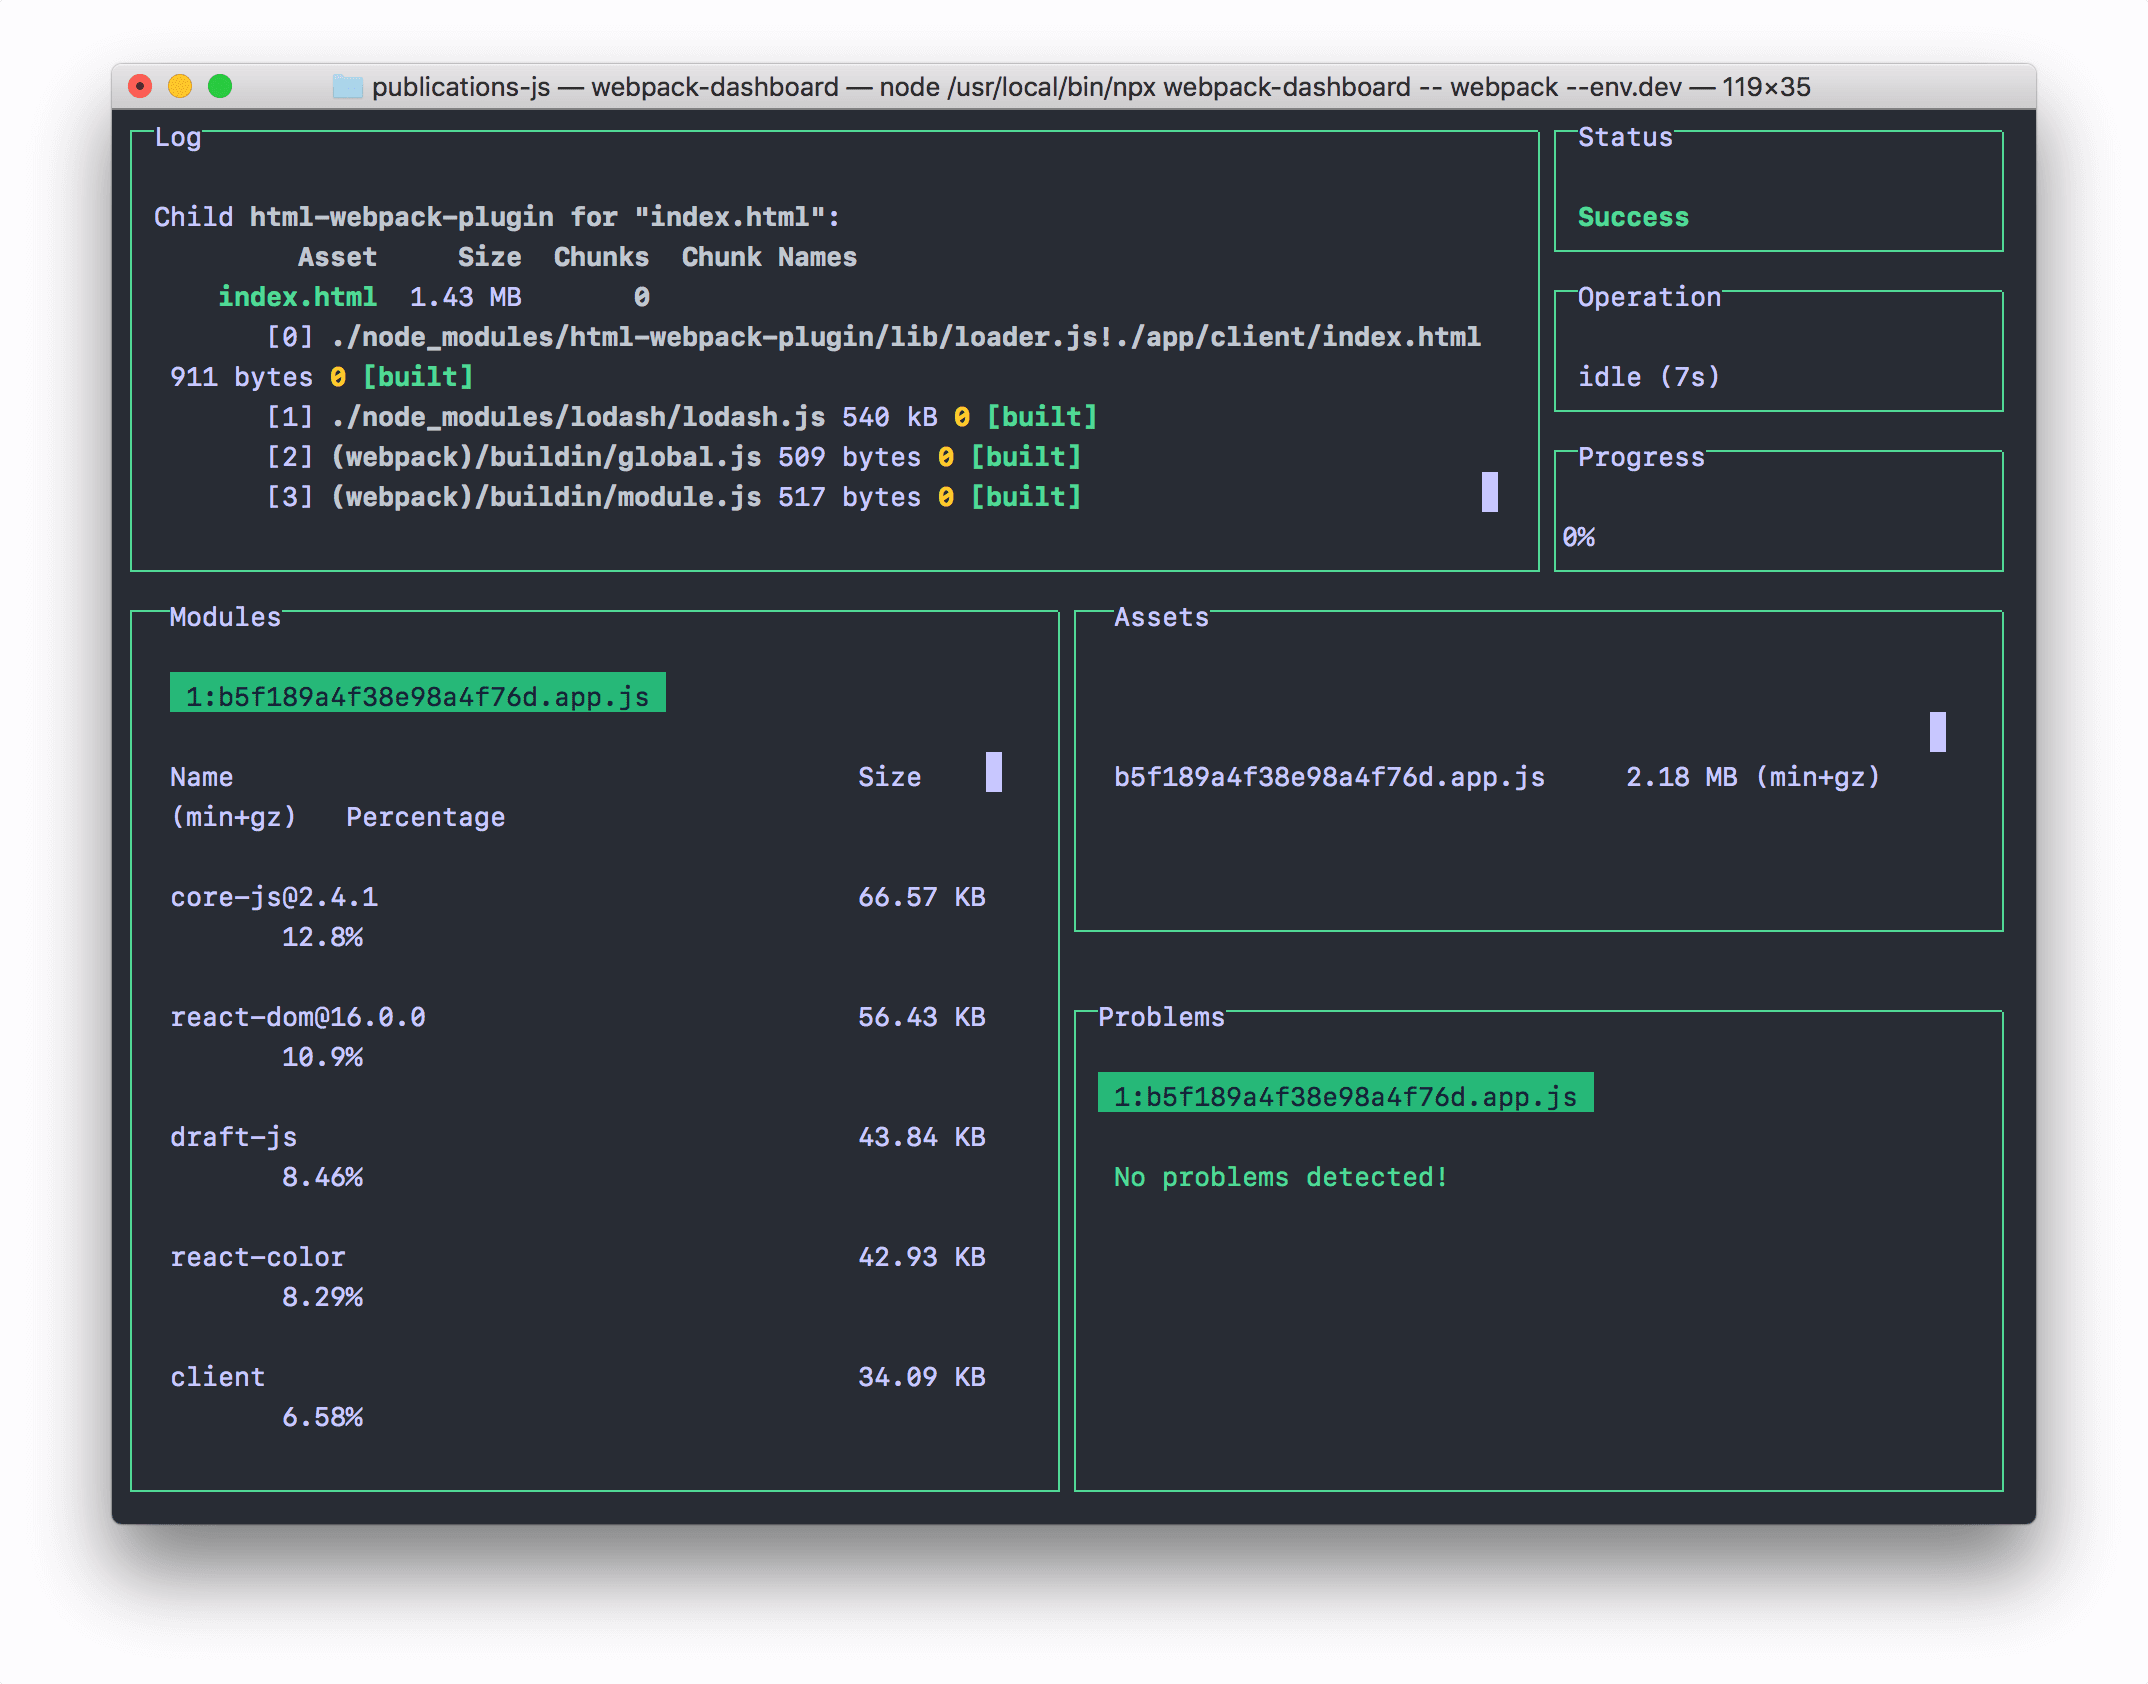
The biggest update to Webpack Dashboard is that it’s now fully compatible with Webpack 3. You can now see the sizes, assets, and any problems for each of your modules. It also still works with Webpack 2.
Other fixes and features:
- Inspectpack no longer runs in minimal mode, and the minimal mode box-sizing issue has been fixed to ensure that panels for status and progress always align.
- The issue with the logs showing duplicate errors has been fixed.
- You can now navigate through the main log using your keyboard arrows.
- We’ve added support for custom hostnames via the plugin config object.
- When the NODE_ENV is production and doesn’t run Inspectpack, Webpack Dashboard now shows a warning instead of displaying errors.
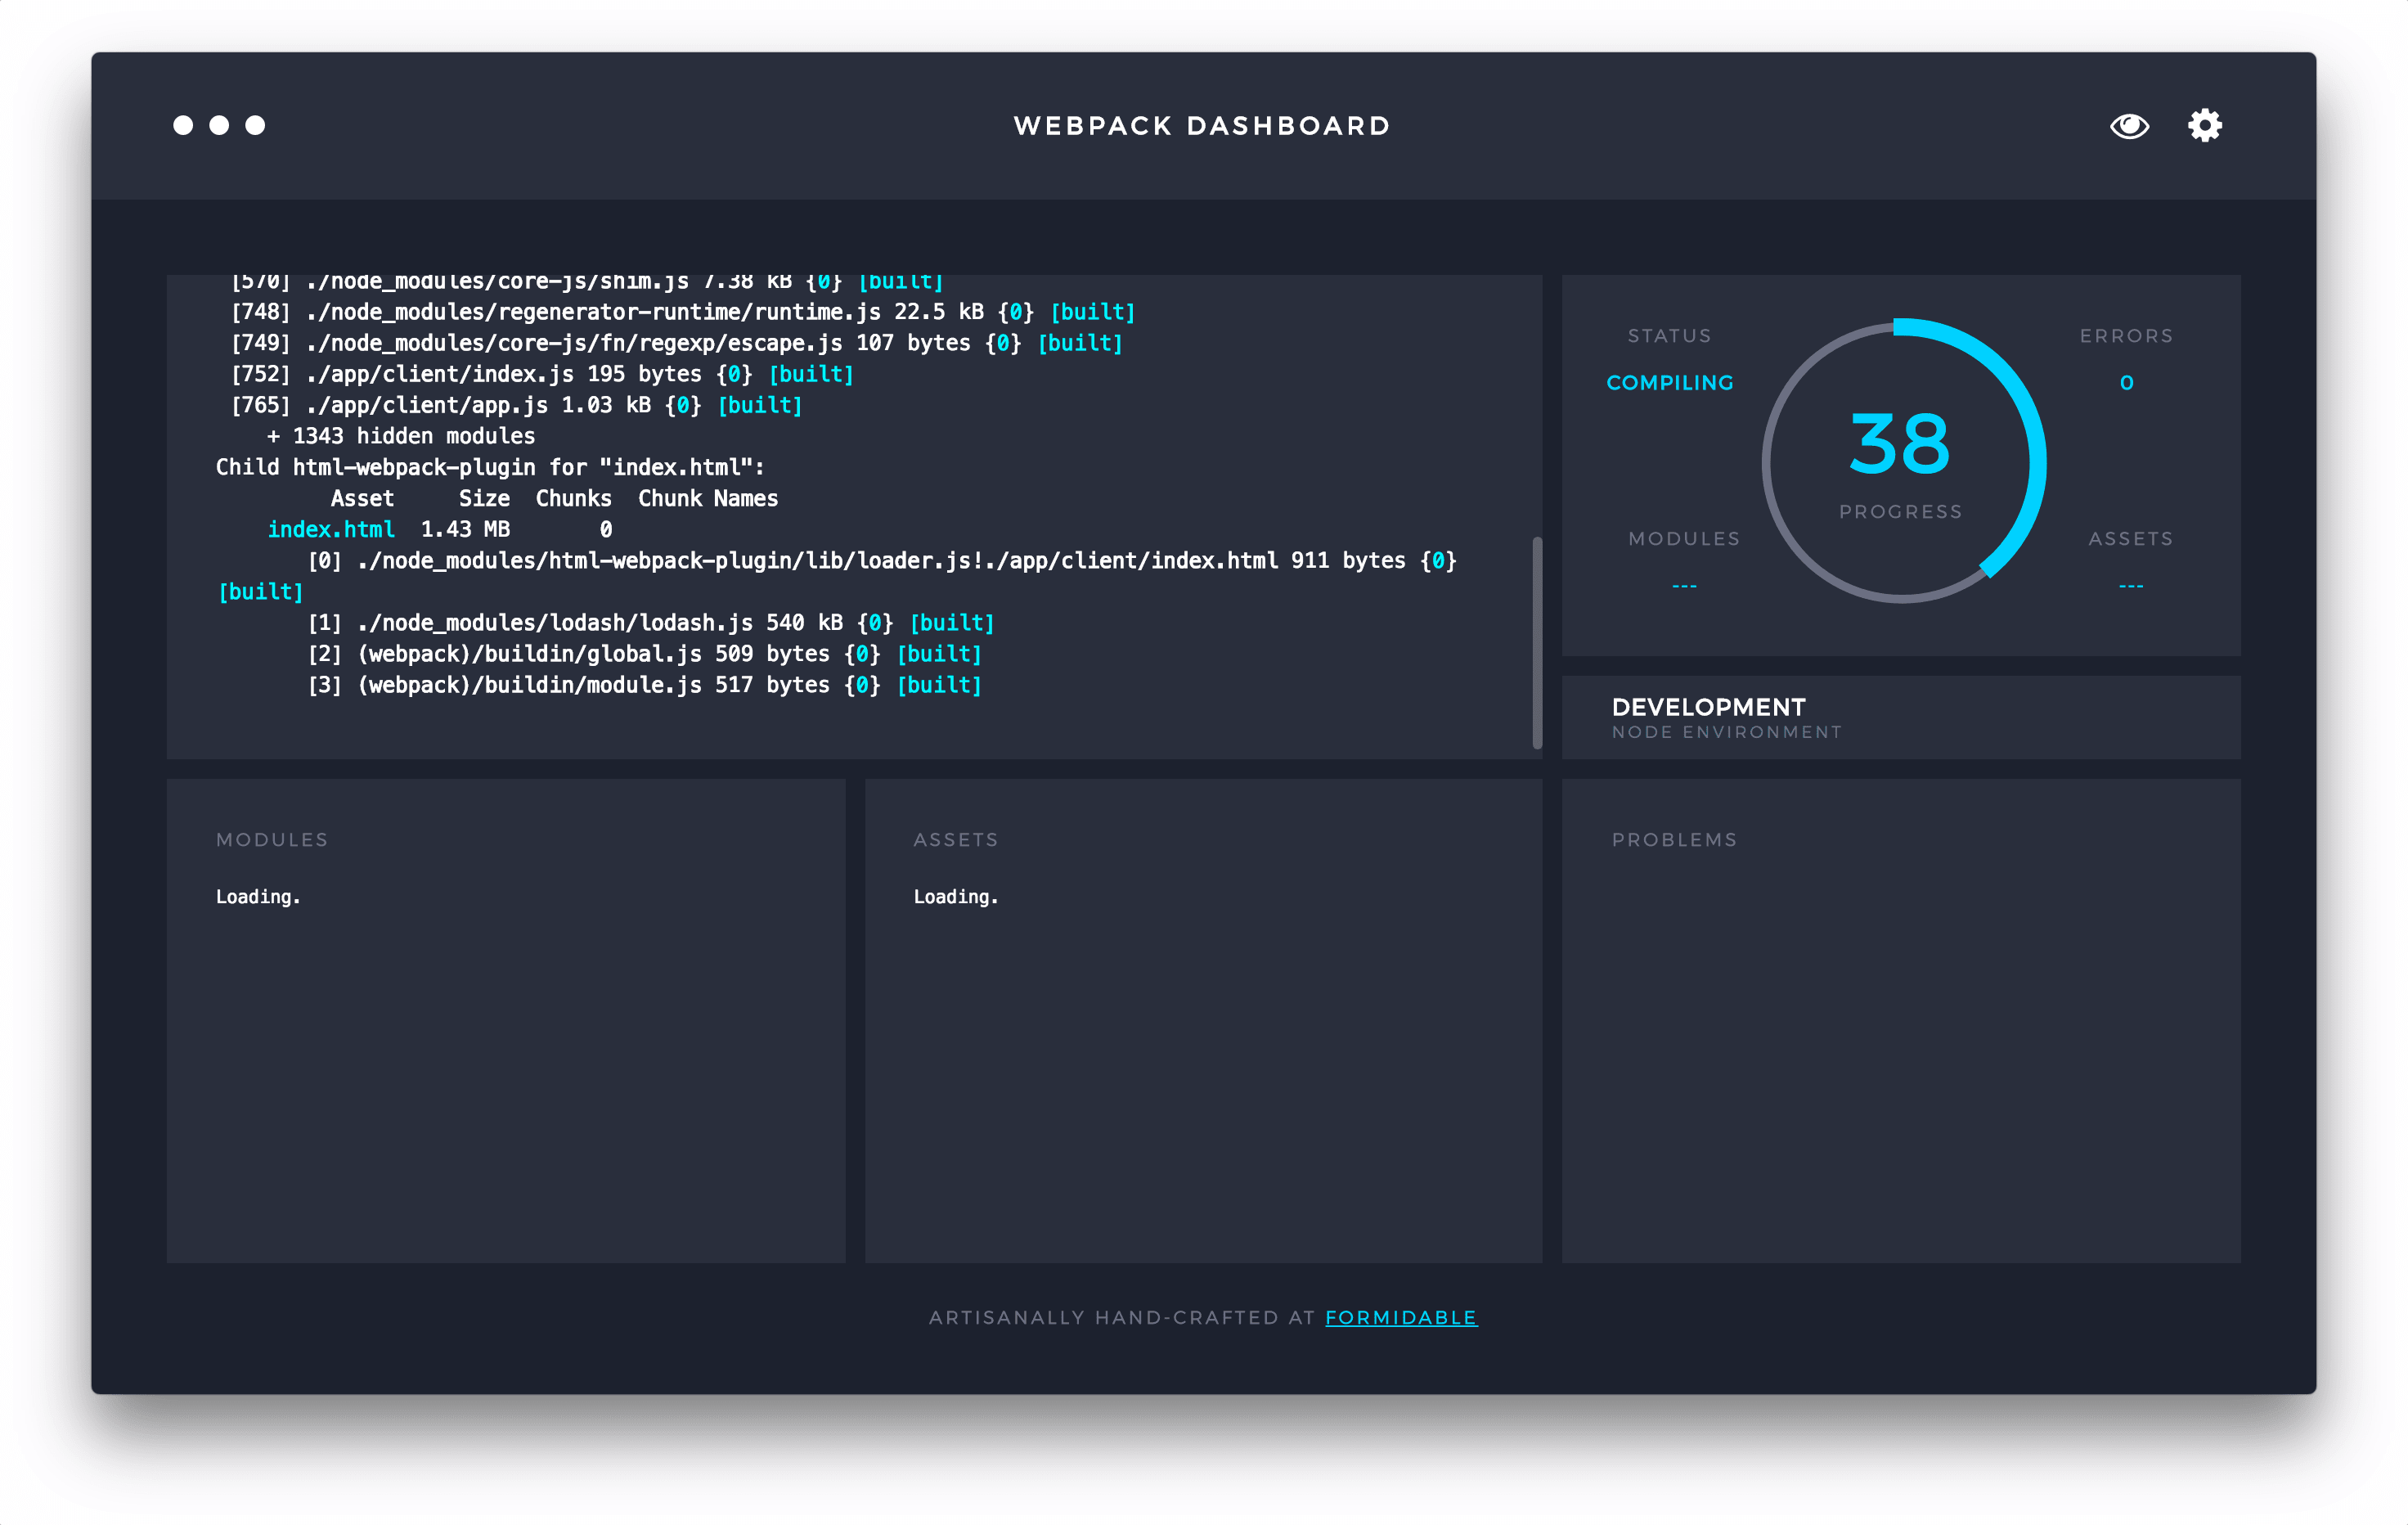
Electron Webpack Dashboard builds upon the Webpack Dashboard 1.0 Plugin and now has full compatibility with Webpack 2 and Webpack 3. We have also added better-looking scrollbars, a status bar for the NODE_ENV, and fixes for various visual glitches.
So What’s Next?
After releasing the beta version of Electron Webpack Dashboard, we had a ton of requests asking us to add capability to run multiple instances for different projects. As a result, we’ll be adding support for multiple tabs and port configurations for macOS, and multiple window support for Linux and Windows.
Beyond that, we intend to evolve alongside the Webpack project. We are excited to see what new features we can do cool things with and look into ways that we can provide even more value and reason to open up the dashboard window. Additionally, we are committed to providing data that’s as accurate as possible and will take care to not misrepresent asset/module sizes in our displays. This will be an iterative process, but because your dashboard updates automatically, it will just roll right out to you.
If you haven’t tried our dashboards yet, give them a spin. We’ve gotten feedback that they have helped companies reduce bundle sizes and unearth bundling issues, so you may reap similar benefits. Worst case scenario, you are just going to look cool AF.